NEW DELHI: The bears tightened their grip on the domestic equity market, and dragged the Nifty index of NSE below the 10,200 mark on Tuesday.
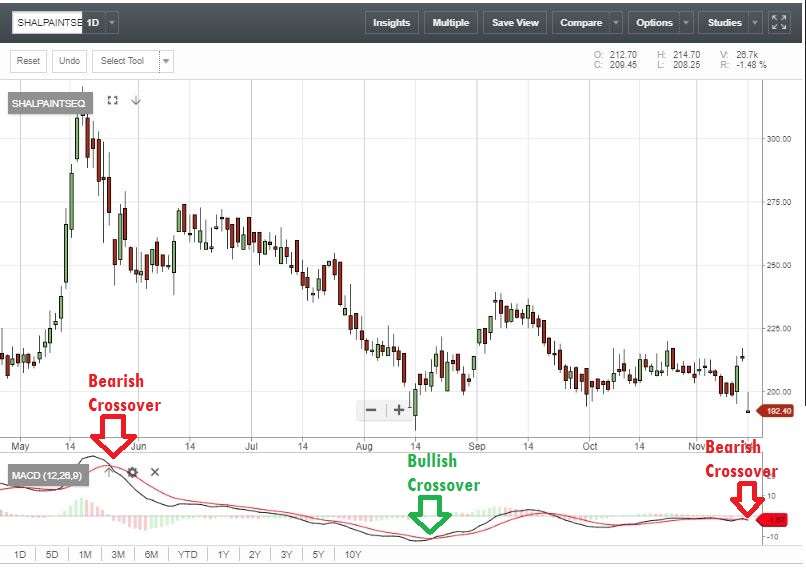
The session witnessed bearish crossovers for 70 stocks on the MACD, or moving average convergence divergence, charts on NSE.
MACD is a momentum indicator known for identifying trend reversals for securities.
Counters that witnessed downward crossovers included CG Power, Syndicate BankBSE -1.70 %, Biocon, Arvind, Aksh OptifibreBSE -4.40 %, Welspun IndiaBSE -2.28 %, Ujaas Energy, MTNLBSE -4.72 %, BEMLBSE -0.51 %, Dabur India and Sun TVBSE -2.18 %.
Some of these counters have also been witnessing strong trading volume, which adds further credibility to the emerging trend.
Other stocks that saw bearish crossovers included Rolta IndiaBSE -4.14 %, Asian PaintsBSE 1.96 %, Shalimar PaintsBSE -2.49 %, AptechBSE -2.21 %, KNR Construction, NRB BearingsBSE -3.46 % and Schneider Electric.
MACD is a trend-following momentum indicator, and is the difference between the 26-day and 12-day exponential moving averages. A nine-day exponential moving average, called the ‘signal’ line, is plotted on top of the MACD to reflect ‘buy’ or ‘sell’ opportunities for investors.
When the MACD falls below the signal line, it gives a bearish signal on the charts, indicating that the price of the security may experience a downturn, and vice versa.

The MACD alone may not be sufficient to help take an investment call. Traders should make use other indicators such as Relative Strength Index (RSI), Bollinger Bands, Fibonacci Series, candlestick patterns and Stochastic to confirm any such trend.
Retail investors should consult a financial expert before buying or selling a stock based on such technical indicators.
Meanwhile, MACD charts also showed that 40 stocks witnessed bullish crossovers on NSE, giving a ‘buy’ signal. They included Vascon EngineersBSE -4.25 %, Repco Home, M&M Financial Services, CESCBSE -1.21 %, Tata MetaliksBSE -3.91 % and BF InvestmentBSE -0.38 %.

The 50-share index Nifty index of NSE settled 38.35 points, or 0.38 per cent, down at 10,186 on Tuesday, while the BSE Sensex ended 91.69 points, or 0.28 per cent, down at 32,941.
The Nifty continues to form lower highs and lower lows, representing a near-term downtrend and it is likely to correct further towards the 10,150 and 10,100 levels, said Rajesh Palviya, Chief Technical & Derivatives Analyst, Axis Securities.
On the upside, the immediate hurdle remains around the 10,230 level and any sustainable move above this will cause a pullback rally towards the 10,280 level, he said.
The Nifty continues to sustain below its 20-day SMA, which signals losing strength. “We can see a correction towards 10,100 and 10,115 levels, which coincide with the 50-day SMA. Some pullback from this support zone in the near term cannot be ruled out,” he said.
Understanding MACD

A close look at the charts of Shalimar Paints shows whenever the MACD line has crossed above the signal line, the stock has always shown an upward momentum and vice versa.
Shares of the company closed 9.80 per cent down at Rs 192.45 on November 14.
[“Source-economictimes”]


